#58 – The Great Debate: Education’s ROI on Patient Health
Episode host: Jonathan Sherbino.

Can the impact on education be measured on patient outcomes? In this episode the hosts take the hotly debate with a recent study published in Jama to their help. Tune in for a discussion that challenges both your workload memory and examines the real-world implications of education in healthcare.
Episode article
Gray, B. M., Vandergrift, J. L., Stevens, J. P., Lipner, R. S., McDonald, F. S., & Landon, B. E. (2024). Associations of Internal Medicine Residency Milestone Ratings and Certification Examination Scores With Patient Outcomes (JAMA).
Episode notes
Background
Buckle up. This is gonna be controversial. We’ve said it here before. The link between education and patient outcomes is a tenous (at best) connection. There are so many confounding elements that some educators – looking at you Dan Schumacher – have advocated for clinician/resident-sensitive quality measures. Essentially, what are clinical markers of care that can actually be influenced – directly – by the practice (and presumably the associated educational intervention) of a resident. Yet, the other side of the house of medicine is asking – (louder and louder) if we invest so much in education, dollars diverted from clinical care for innovation and scholarship – where is return-on-investment for patient care. This side of the house asks an “engineering pipeline”-type question.
Asche (2014) and Chen (2014) have separately conducted programs of research that demonstrate that where you trained impacts the quality of care you deliver once in practice. But, the analysis is at the level of the training program. The connection between an individual’s in-training assessment and performance in practice has been most famously shown by Tamblyn. (See Tamblyn, 2002.) And the association between knowledge entrance exams and graduation from training has been established in numerous studies of undergraduate and professional training programs. But these associations are based on knowledge exams. Critics counter that this association is simply predicts ability to complete knowledge tests: a test-taking competency. (See for example the controversy around college entrance exams and sociocultural disadvantage.)
The movement to competency-based education and associated assessments of performance of cognitive, technical and affective skills was intended to advance this debate. So, will competency-based education, and the associated competency-based assessments, lead to better patient outcomes?
Purpose
To examine the association between physicians’ milestone ratings and certification examination scores and hospital outcomes for their patients
(Gray et al., 2024)
Methods
This is a retrospective cross-sectional database analysis of United States hospitalist admissions:
- 3rd year IM residents (2016-18) who graduated and cared for (within 3 days of admission),
- Medicare patients > 65yo (nonelective, nonhospice) who were hospitalized (2017-19),
- For 25 common diagnoses in
- Moderate or greater-sized (>100 bed) hospitals.
A multivariate regression analysis was performed using:
- Primary clinical outcomes of mortality or readmission at one week.
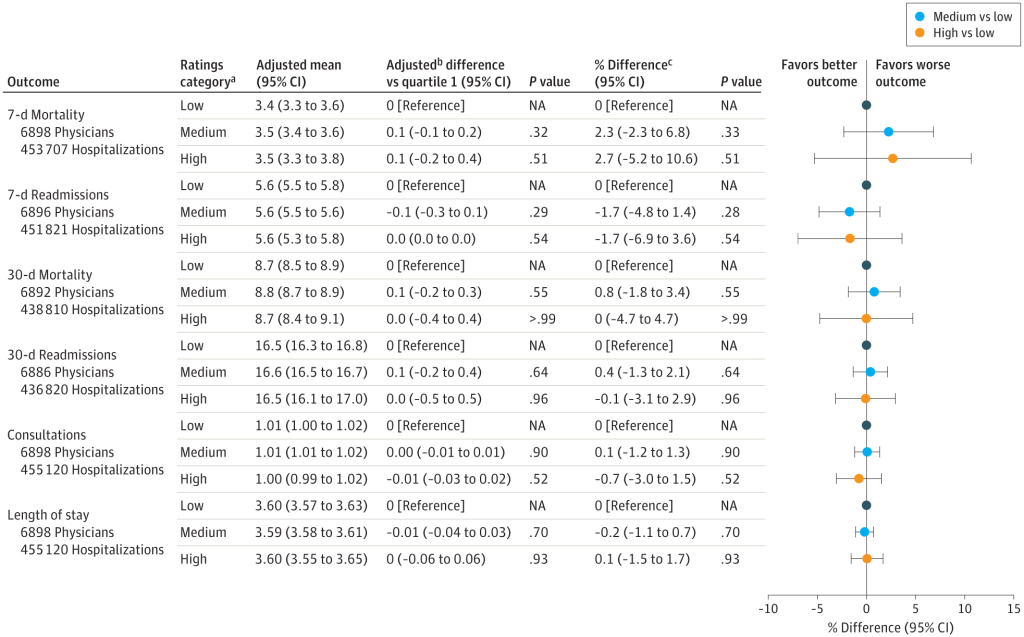
- Mean milestone ratings of 22 sub-competencies across 6 categories (patient care, medical knowledge, practice-based learning and improvement, systems-based practice, interpersonal and communication skills, and professionalism) on a 9-point scale, where < 7 = low and >=8 equals high based on range restriction of the data.
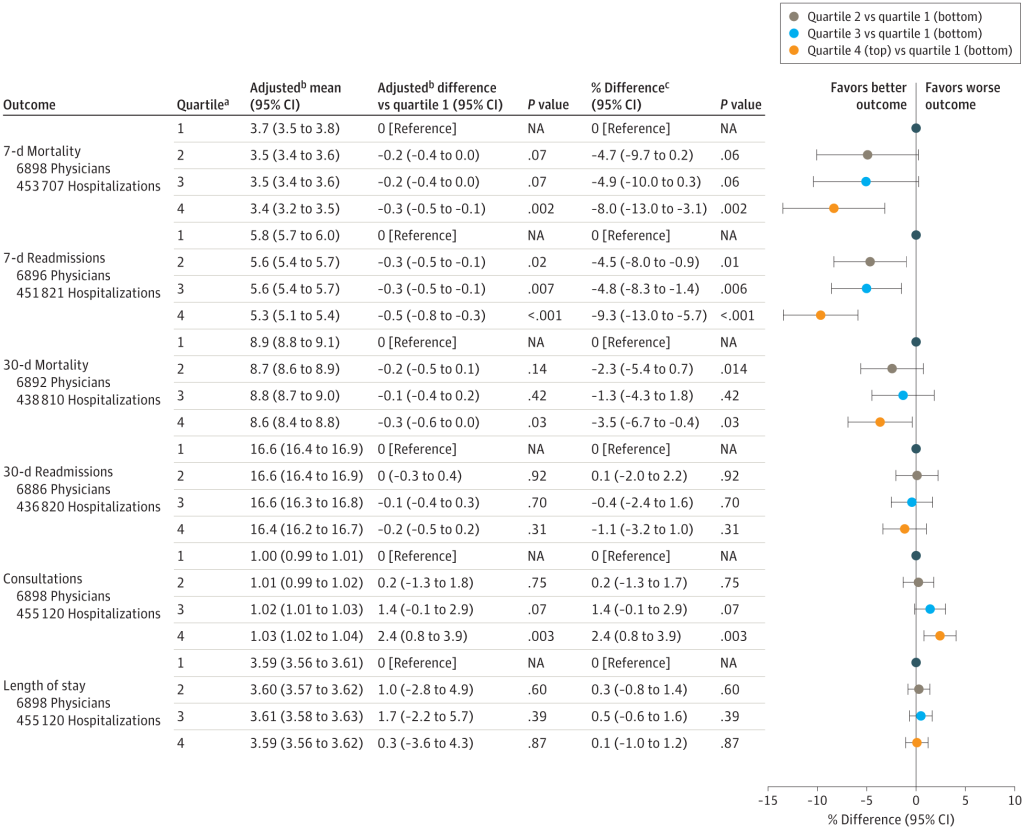
- Knowledge test scores, on national certification exams (first attempt), analyzed by quartile performance.
Results/Findings
Nearly 7k practising hospitalists caring for more than 455k patients in nearly 2k hospitals were included.
25% of admissions were by a physician in the low competency rating category (8% high); 90% of admissions were by a physician who passed the knowledge exam on the first attempt.
There were no significant associations between top vs. bottom competency ratings (overall or for medical knowledge competencies) and any hospital outcome measure.
Top knowledge examination score quartile had a 8% reduction in 7-day mortality and 9% reduction in readmission compared with the bottom quartile.
Sensitivity analysis showed no impact on outcomes when adjusting for clinical or statistical assumptions.
References
Asch, D. A., Nicholson, S., Srinivas, S. K., Herrin, J., & Epstein, A. J. (2014). How Do You Deliver a Good Obstetrician? Outcome-Based Evaluation of Medical Education: Academic Medicine, 89(1), 24–26.
Chen, C., Petterson, S., Phillips, R., Bazemore, A., & Mullan, F. (2014). Spending Patterns in Region of Residency Training and Subsequent Expenditures for Care Provided by Practicing Physicians for Medicare Beneficiaries. JAMA, 312(22), 2385.
Tamblyn, R. (2002). Association Between Licensure Examination Scores and Practice in Primary Care. JAMA, 288(23), 3019.

0 comments